Sustainable growth report 2023

Sustainable growth report 2023

ENVIRONMENT STRATEGY

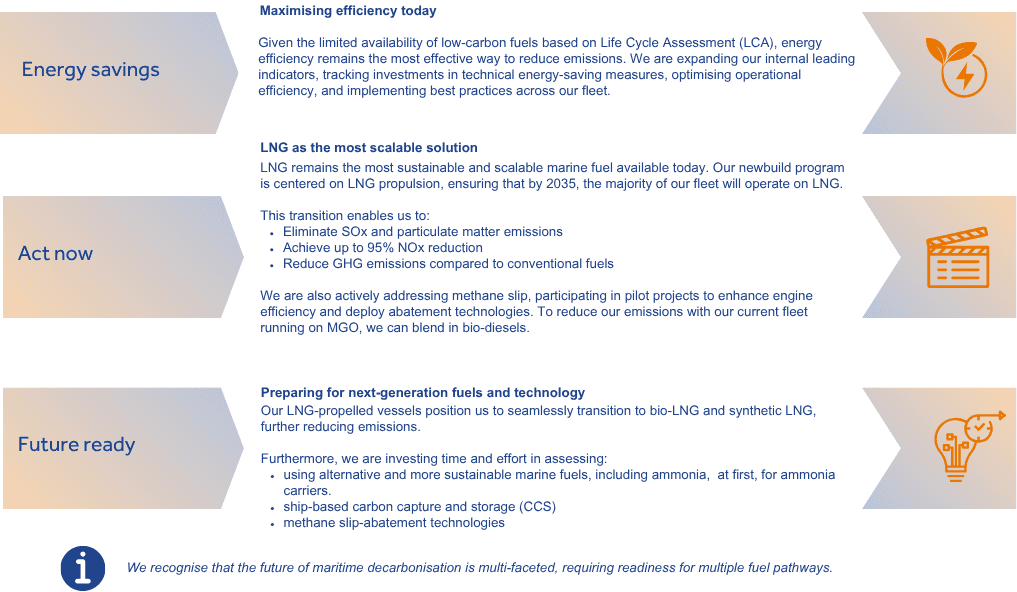
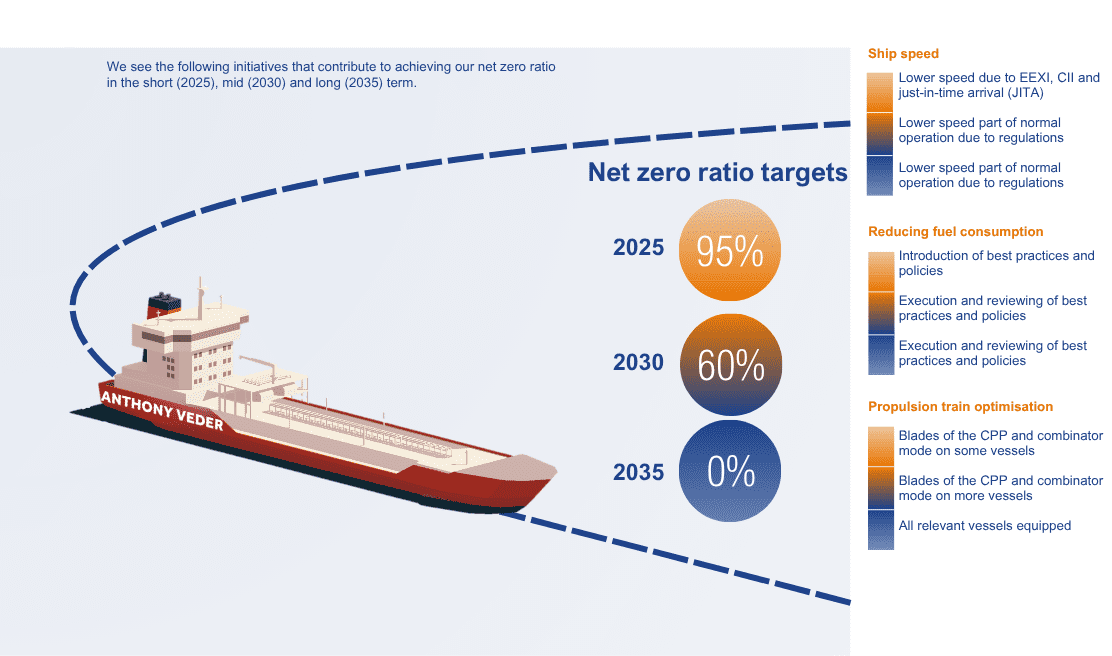
Last year we embraced the very ambitious target of becoming net zero in GHG (greenhouse gases) by 2035. We have a strategy based on 3 pillars to reach this target: energy savings, act now and future-ready.

For existing vessels and newbuilds we analyzed the impact of reducing emissions in relation to the investment required. We refer to the Value Mapping paragraph that can be found later in this chapter.


We are working on expanding our set of internal and external leading indicators, that needs further detailing coming years.

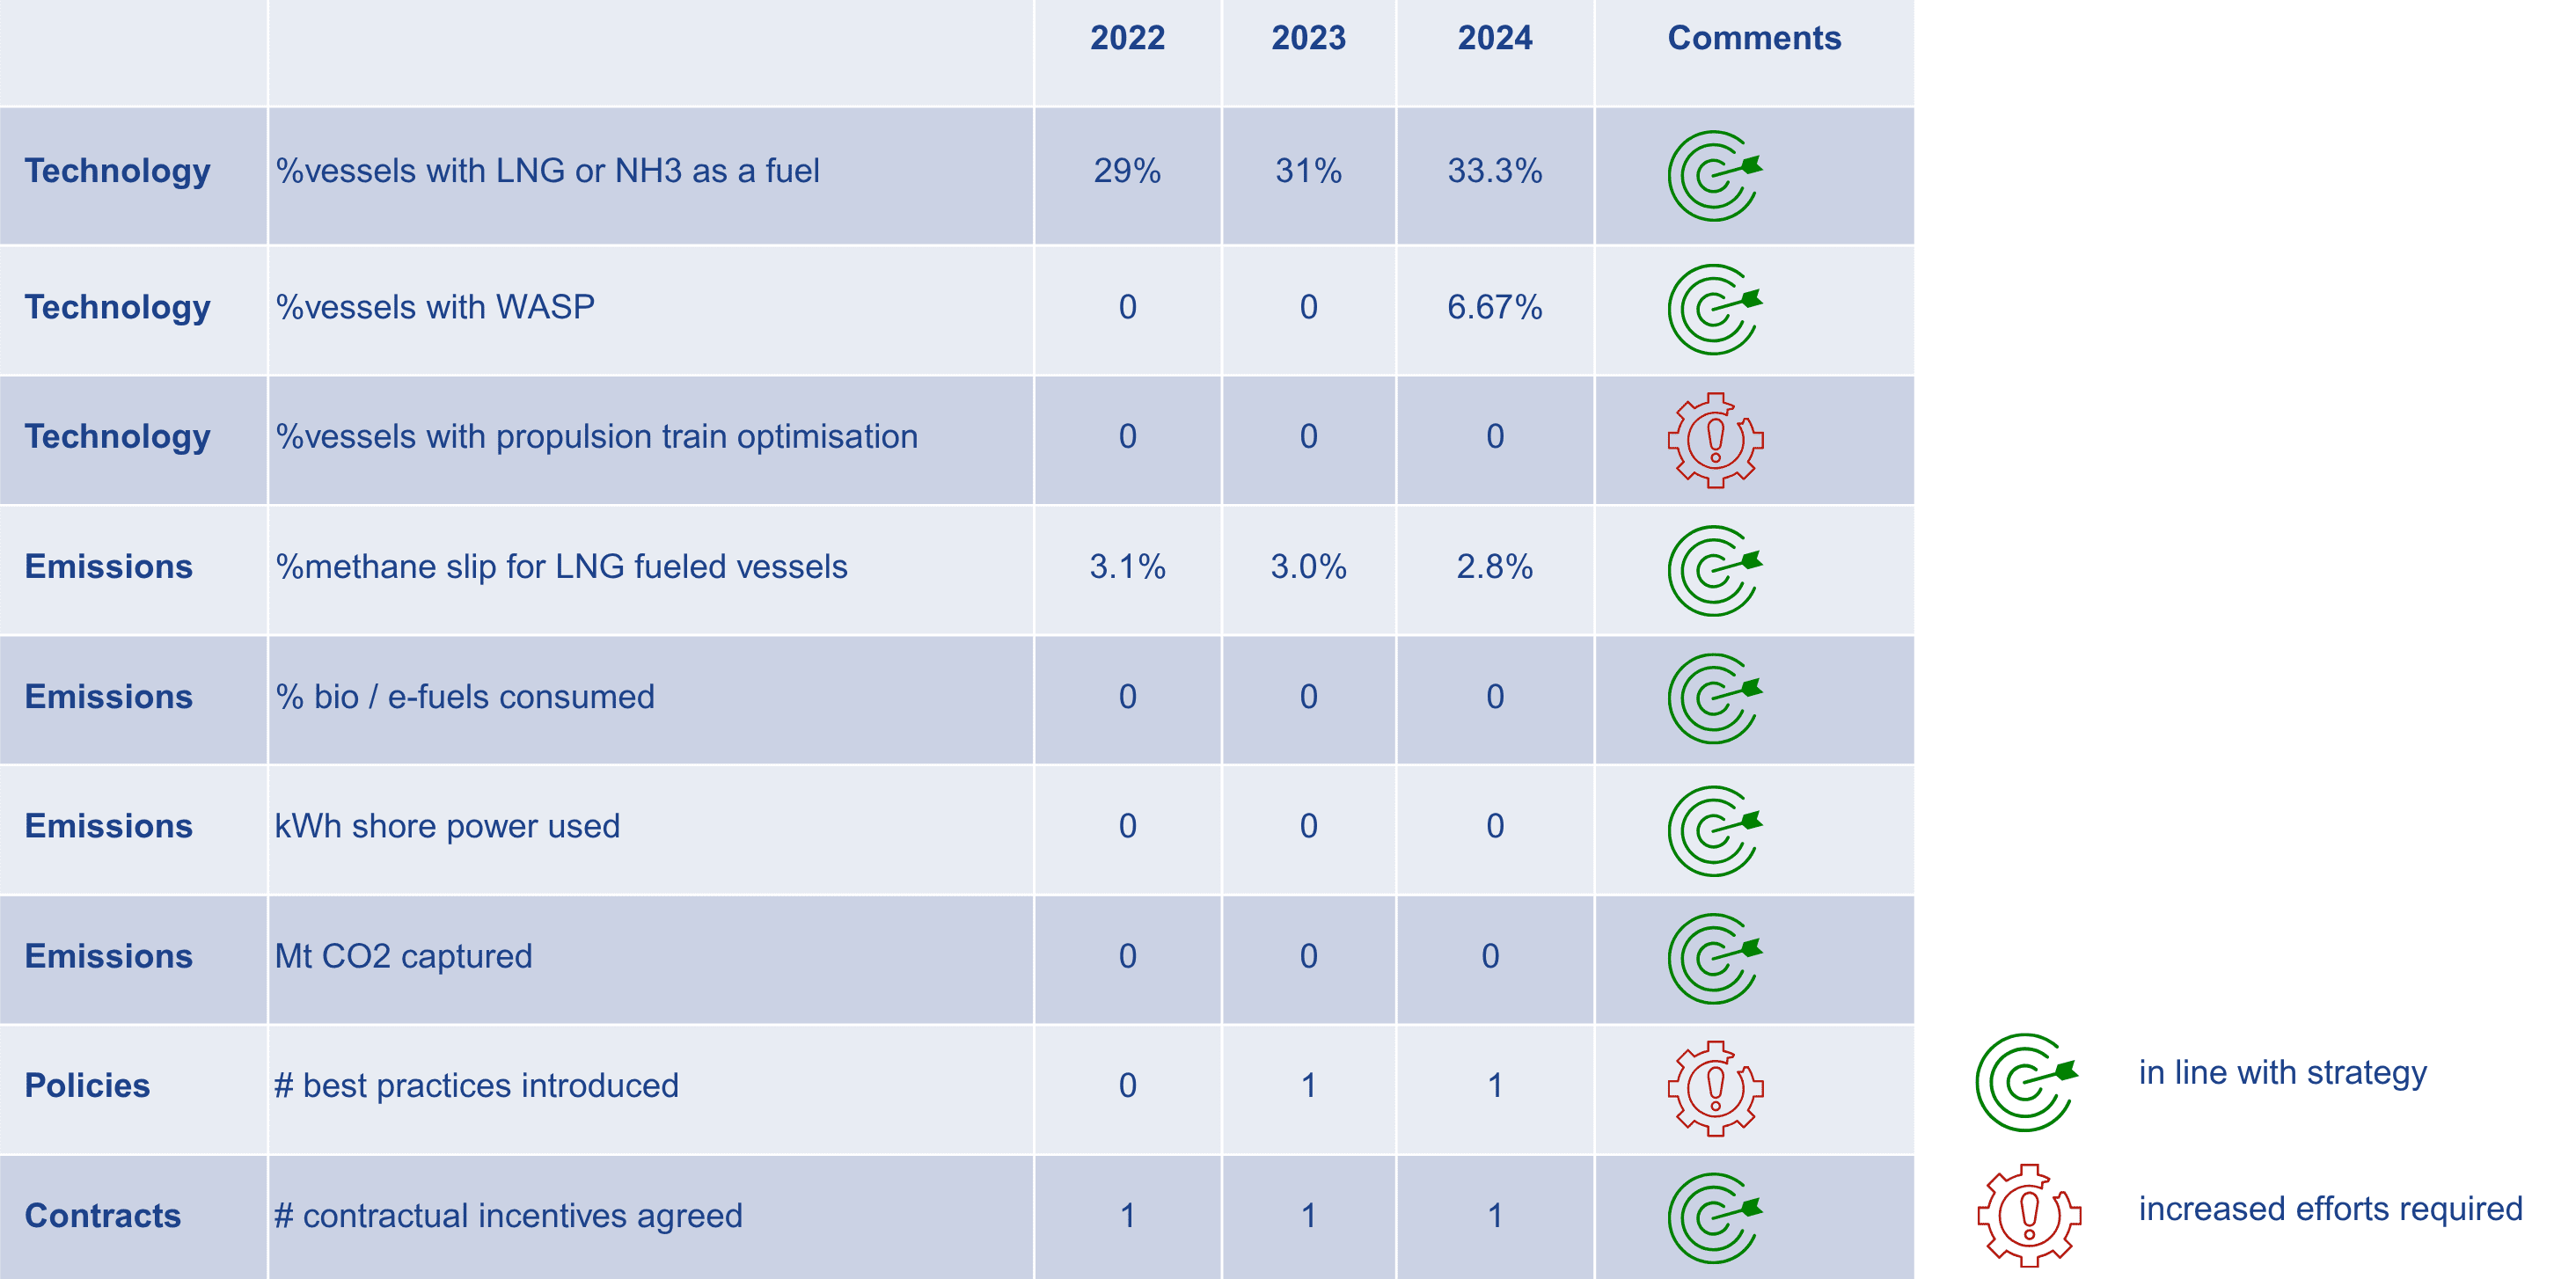
LEADING INDICTATORS – INTERNAL

  • Total investment made on technical energy saving measures
  • Technical energy efficiency measures taken on board
  • Development of best practices for energy saving measures on board
  • % of LNG as fuel used on Dual Fuel (DF) capable vessels
  • Governance / policies implemented to incentivise reducing emissions (e.g. venting policy)

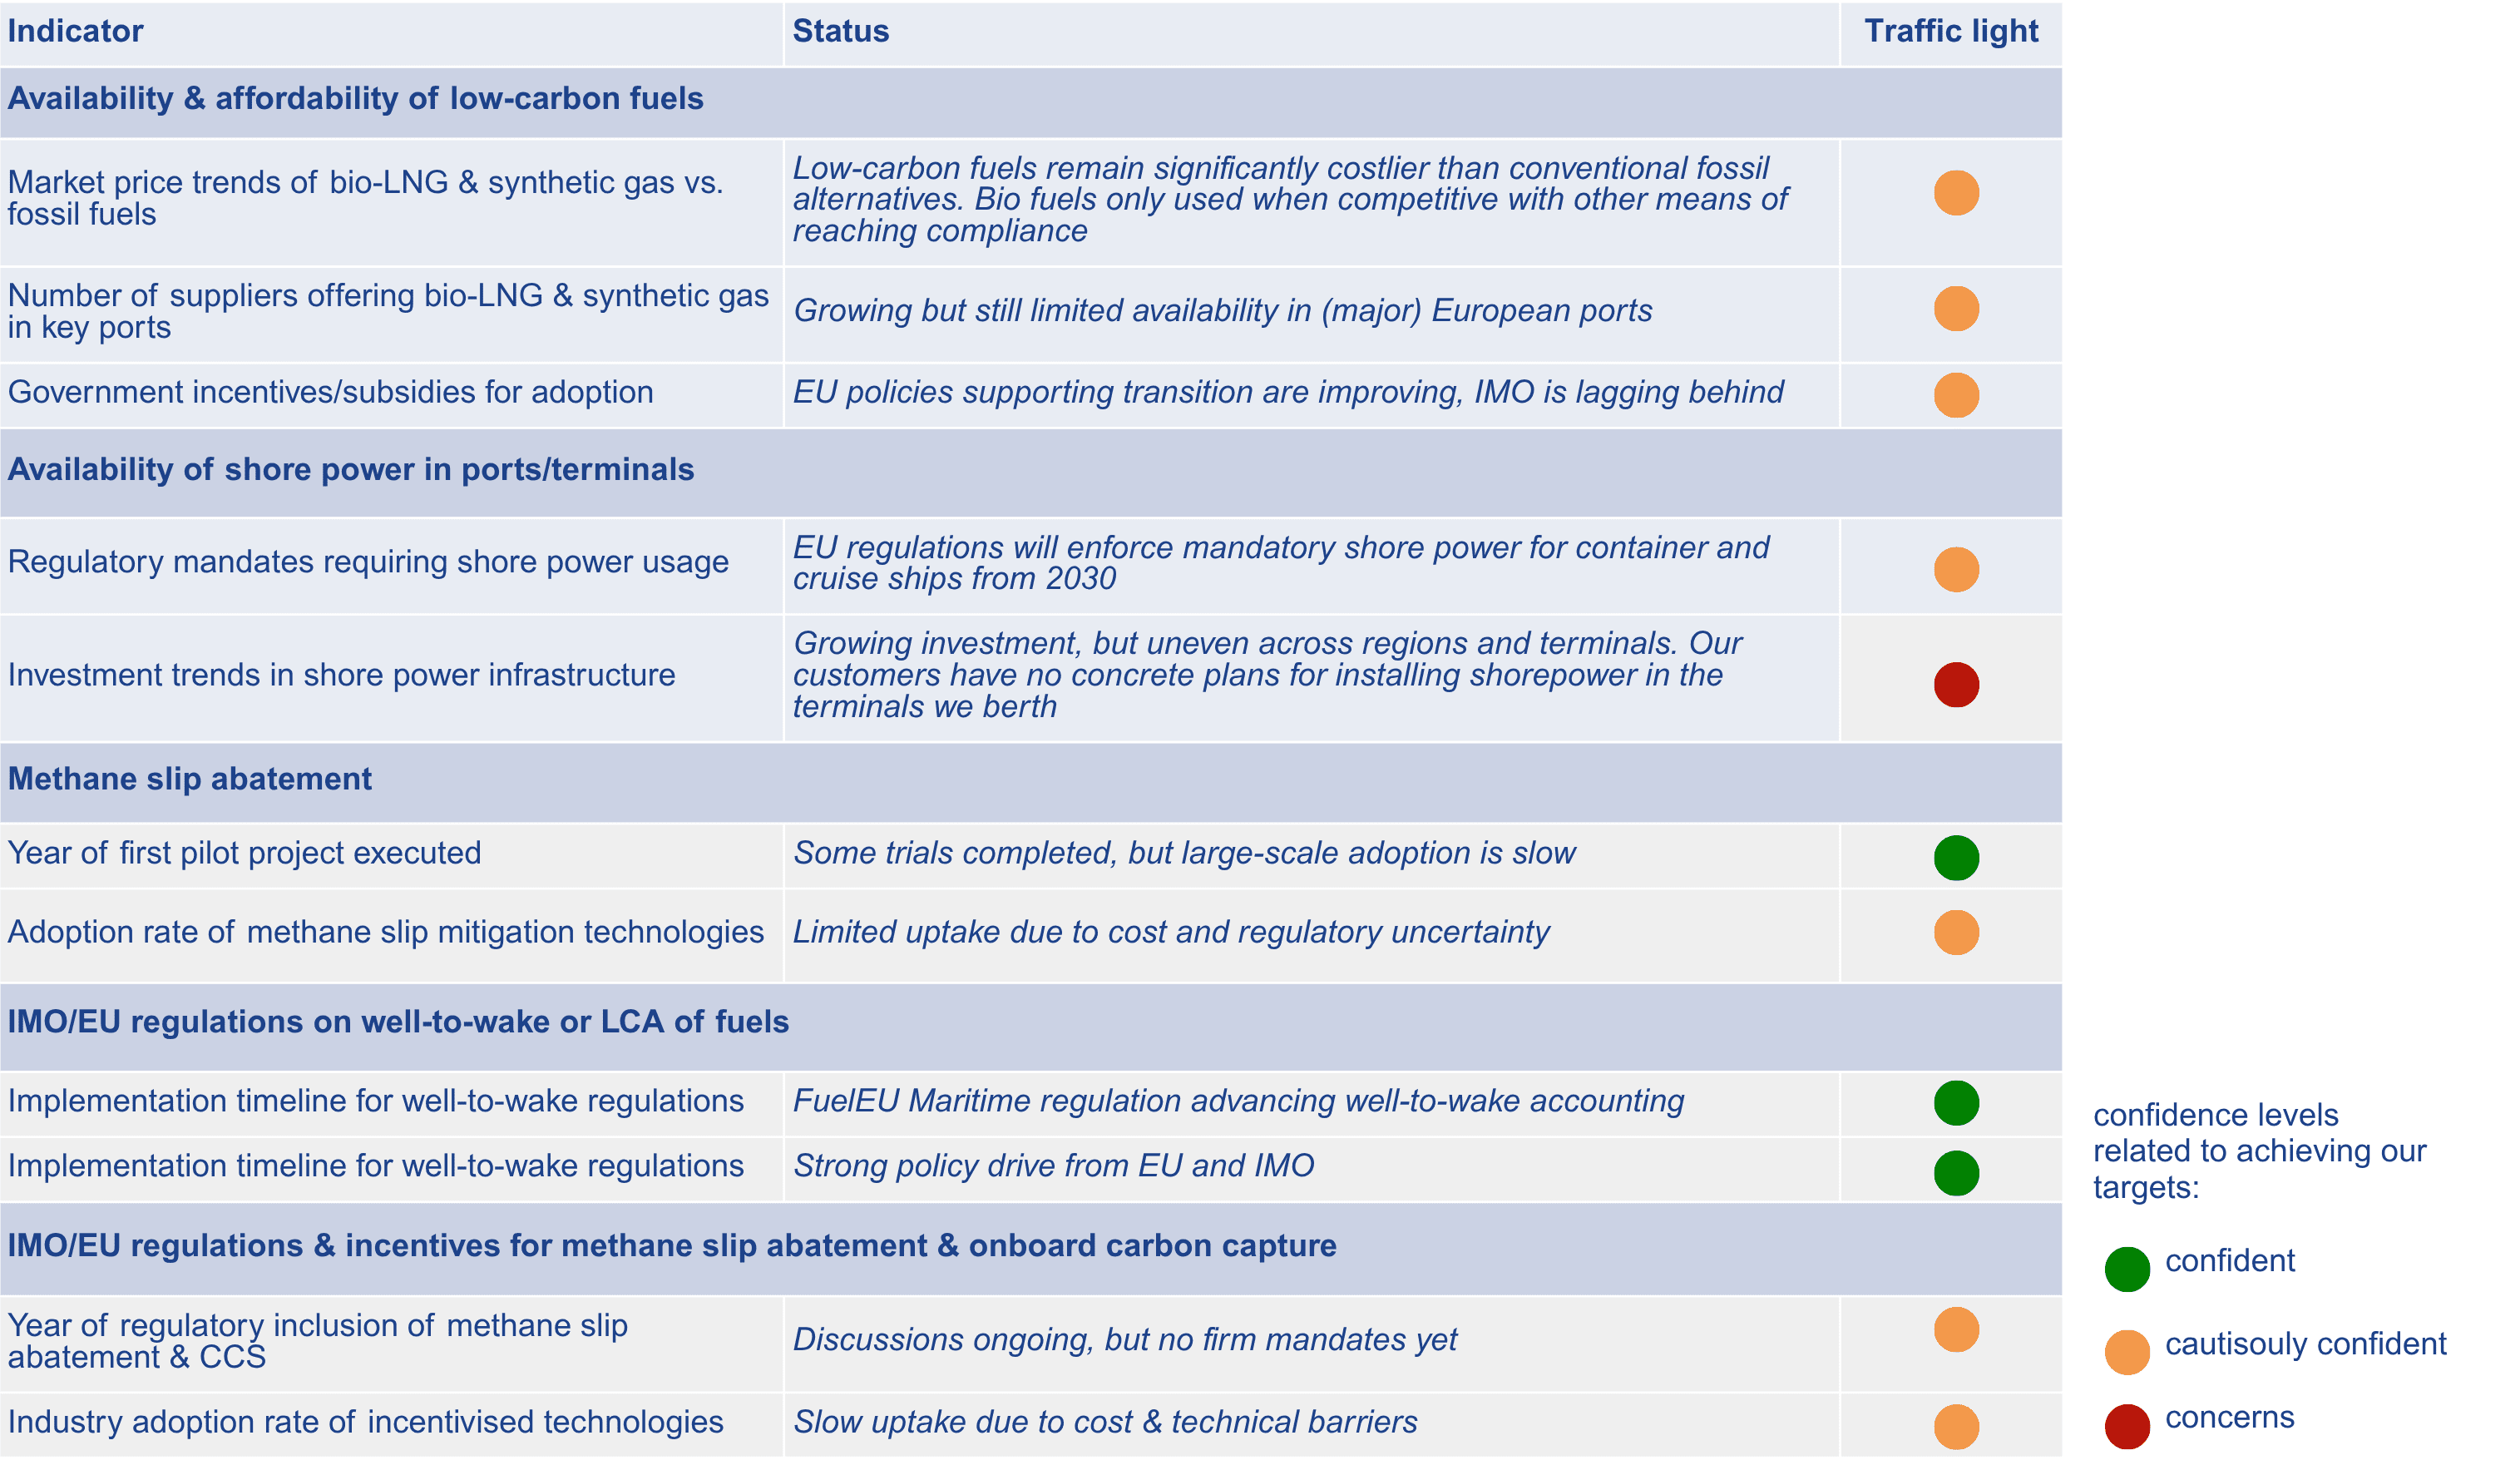
As our ambition over time becomes more dependent on external stakeholders, such as our customers, governments and other regulatory bodies we consider the following external leading indicators.

LEADING INDICATORS EXTERNAL

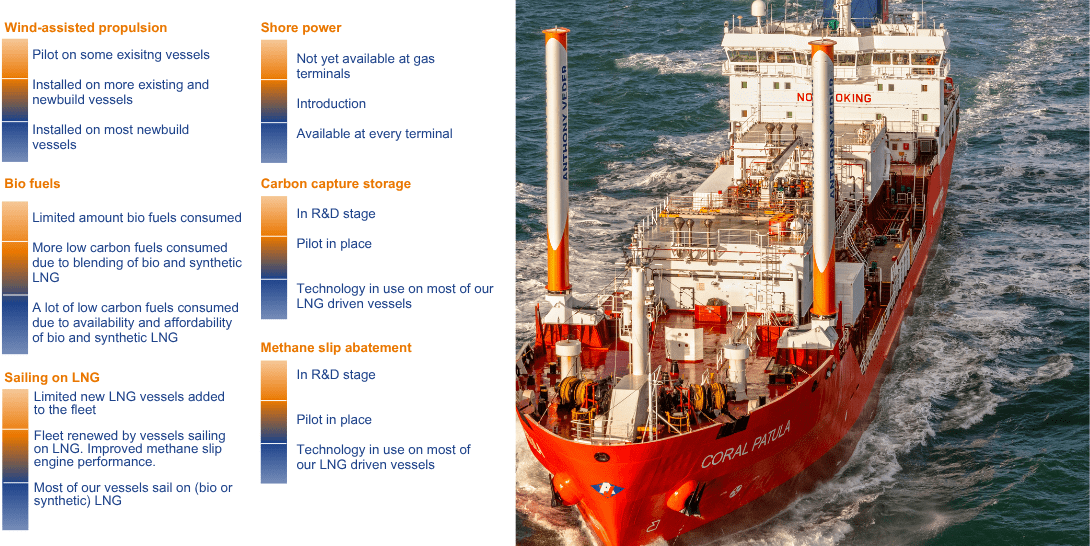
  • Availability and affordability of low carbon fuels compared to the fossil alternative, such as bio-LNG and synthetic gas
  • The availability of shore power in ports/terminals that we visit
  • Methane slip abatement: year of finalization of technology for our type of vessels, year of first (pilot) project executed, % of methane slip reduced by better engines and/or abatement technologies
  • Ship based carbon capture: year of finalization of technology for our type of vessels, year of first (pilot) project executed, readiness for logistics of CO2 offloading and its onward transport and utilisation and/or geological storage, % of carbon captured and disposed
  • IMO / EU regulations to include well-to-wake or LCA of fuels as means to reduce emissions
  • IMO / EU regulations and/or incentives to include methane slip abatement and/or on-board carbon as means to reduce emissions

More specific clarifications on regulations related to emissions can be found under the Governance section.

VALUE MAPPING

To support the execution of our environmental strategy we have created a value map. A set of 60 emission reduction measures has been rated on its effectiveness on emission reduction versus the investment made. This is presented in a graph: the value map.

Conclusion from the value map:

Shore power
Shore power is very attractive in terms of CO2 reductions and payback time related to the investments needed on the vessels; we need our customers to arrange for the necessary investments at the terminal.

Subcooler
The subcooler is attractive for reducing emissions. It comes with a high investment, when only considering reducing CO2 emissions, payback time would be negative. However, not only CO2 is reduced as the main objective of a subcooler is saving cargo. The LNG cargo has a much higher value than CO2 and when this would be factored in, a subcooler installation on certain LNG carriers could financially become very attractive. When installed, it means we are in control of our Boil-off Gas (BOG) and do not need our main engine anymore for that purpose which enables taking other measures as well, such as reducing speed in combination with engine tuning and wind assist.

Combinator mode
Combinator-mode and engine tuning can be done at relatively low investments: these are considered quick wins, its effectiveness is however subject to the operational profile of the vessel.

Heat recovery
This comes with higher investments and is less effective on reducing emissions and would be a next step.

Propeller mode
Propeller mode, like combinator mode, can be done at a relatively low investment and considered quick win.

Wind assist
Wind assist also comes with a higher investment, however has the advantage of reducing monetary penalties under the Fuel EU regulation, which has not been factored in. Also, the measure is visible which supports our sustainable image and herewith positively contributes to sustainable behaviour.

How to read the value map:

  • The graph shows the relative performance of a measure compared to the other measures, and secondly it shows the financial attractiveness.
  • On the horizontal axis the relative emission performance is states in ton CO2 prevented
  • On the vertical axis the equivalent levelised annual amount in USD per ton CO2 prevented is given. The dot size of the measure, indicates how effective the measure is in preventing emissions.
  • The location of the dot in the graph shows its attractiveness.
  • Dots in the upper right corner are relatively good performing, with relatively shorter pay back times.
  • The dots in the bottom left corner are relatively poor between other measures, with much longer pay back times.

There are groups of measures however, with a strong interdependency or exclusion, which we need to understand better.
This could lead to either combining measures for a better result or excluding measures as they have a negative effect on another solution.

Example given to indicate the complexity of the value map and interrelation between measures that can be taken to reduce emissions for a situation whereby speed is reduced due to regulations or voyage optimization:

  • The measure considered: change of set up of propulsion train from fixed RPM mode to combinator mode (decrease engine RPM and propellor pitch).
  • The negative effect: by reducing the engine RPM we lose the shaft power functionality, resulting in starting auxiliary engines. These engines have a smaller bore, and the fuel efficiency is less than the main engine fuel efficiency, meaning we lose part of our benefit of change of propulsion set up to combinator mode.
  • The alternative: install a variable frequency drive (VFD) on the shaft generator switchboard that allows the frequency to match the ship’s frequency. The Coral Nordic has such VFD from newbuilding. We noted it is quite a large impact to procure, install and integrate such device on an existing ship, which negatively affect the financial attractiveness.

Concluding, what we learned so far is, that although speed reduction could be an effective way to reduce carbon emission, it is not straightforward on our gas carriers. It requires upgrades to the electrical system, propulsion system, propulsion control system and propeller blades to maximise the effect.

In 2024, we will be starting with trials onboard with measures with low interdependencies, the quick wins and wind assist. Furthermore, we will work on assessing measures with more interdependencies. Also work will be done on vessel specific value maps following from the drydocking planning.

To measure the performance of the execution of our environmental strategy, we focus on:

  • Net Zero green house gases
  • Cargo Vapour emissions
  • Other emissions
  • Refrigerants emissions
  • Waste Management

We are working towards net zero GHG emissions and reducing all other emissions which are influenced by being our shipping operations. We furthermore recognise behaviour and sustainable projects as important drivers to achieve our net zero ambition.

To ensure the best experience on our website, we use cookies. Click 'I agree' to accept the cookies. You can click here to read our cookie policy.

I agree