Sustainable growth report 2024
Sustainable growth report 2024
NET ZERO GREEN HOUSE GAS EMISSIONS
This section outlines funnel emissions and the various methodologies used to calculate related metrics. The operational data for our vessels in 2024 has been successfully uploaded, validated, and approved in compliance with IMO DCS and EU MRV requirements.
Emission calculations and reporting approach
The emissions presented in this report use AR5 emission factors. These calculations include CO₂, N₂O, and CH₄, assessed using tank-to-wake and well-to-wake methodologies. For reporting purposes, we apply the ‘control by contracts’ approach, which has been used to derive AER and NZR scores, further details are available in the definitions section.
Upcoming changes to emission factors
Currently, FuelEU employs AR4 emission factors, but a transition to AR5 is anticipated next year. Therefore we already use AR5 emission factors.
Methane slip considerations
Methane slip continues to be measured as a percentage of fuel consumption, with variations depending on engine type (Otto DF medium speed, Otto DF slow speed, Diesel DF slow speed, LBSI). Discussions within the EU and IMO are underway to explore switching to performance-based measurements, which would account for technological advancements improving engine efficiency over time.
Additionally, the regulatory framework does not currently factor in methane slip abatement technologies, though this remains an ongoing area of debate. With regulations and technologies evolving, we remain proactive in refining our emissions reporting and strategy to align with future industry standards.
Results from emission figures
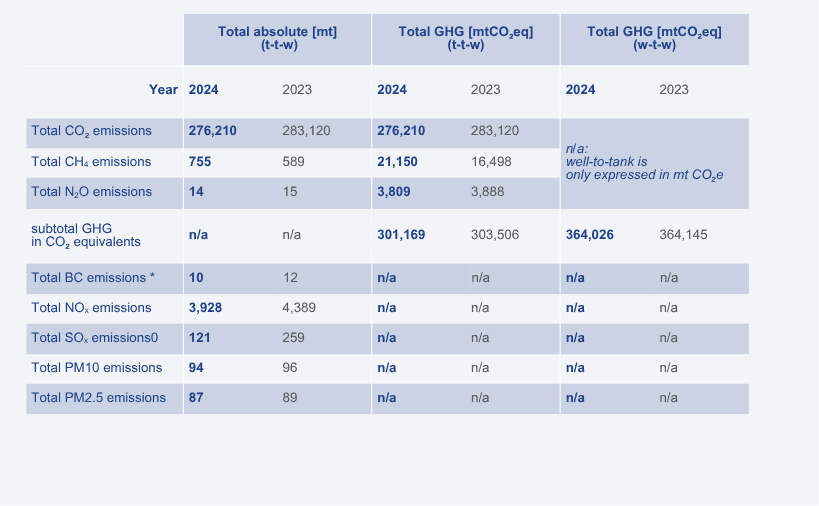
In 2024 Coral Rigida and Coral Rubrum left the fleet, these vessels were sailing on MGO and LSFO. Coral Evolution entered the fleet, sailing on LNG, and using MGO as pilot fuel.
Therefore, we see the following changes in the emissions:
- Looking at GHG, the total CO2 & N2O emissions were less than 2023, but the amount of CH4 emissions increased.
- Looking at the non-GHG emissions, the amount of Black carbon, NOx, SOx, and PM (2.5 and 10) have decreased.
Other significant changes in 2024:
- Coral Favia, Coral Fraseri and Coral Furcata stopped sailing to the DRG terminal and were part of the normal Anthony Veder trade again.
- Coral Encanto started doing international voyages from October 2024, and stopped acting like an FSRU.
Annual Efficiency Ratio (AER) and Net Zero Ratio (NZR) assessment
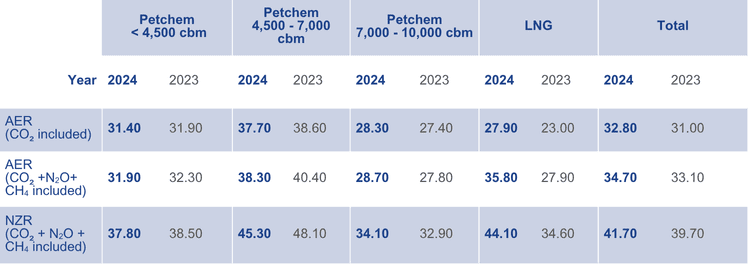
By analysing funnel emissions, we derive the Annual Efficiency Ratio (AER) based on tank-to-wake emissions, while the Net Zero Ratio (NZR), introduced in 2022, is calculated using well-to-wake emissions. These metrics are heavily influenced by vessel trade patterns and operational utilisation. Any period when a vessel is idle and consuming fuel negatively impacts both AER and NZR scores.
Optimising performance
To enhance efficiency, maintaining control over operational profiles is essential. If improvements are necessary, close collaboration with customers is required to optimise AER performance.
Trade segment differentiation
We categorise vessel operations into four specific groups:
- Petchem vessels < 4,500 cbm
- Petchem vessels 4,500 – 7,000 cbm
- Petchem vessels 7,000 – 10,000 cbm
- LNG vessels
Performance trends (2022-2024)
Overall, the 2024 scores show a decline compared to 2022 and 2023. A closer look at individual segments reveals the following trends:
Small petchem vessels
<4,500 cbm & 4,500 – 7,000 cbm:
NZR has gradually decreased over the past three years.
Larger petchem vessels
7,000 – 10,000 cbm:
NZR has improved compared to last year. Wind assisted measures implemented on Coral Pearl and Coral Patula have yet to show results, as they were introduced late in the year. Significant idle time in vessels such as Coral Fungia also impacted performance.
LNG vessels:
A notable increase in NZR compared to 2023. The primary contributors to this change are Coral Encanto and Coral Favia.
- Coral Encanto: Previously excluded from NZR assessments in 2023 due to non-international voyages. Now engaged in occasional international travel but experiencing short distances and frequent idle periods.
- Coral Favia: Underwent significant modifications and now operates as a bunker vessel in the Caribbean, leading to low sailing distances and high idle time.
Key takeaways
While efficiency trends vary across vessel segments, operational adjustments and technology enhancements will be critical in driving future improvements in AER and NZR scores. Close monitoring and strategic planning will ensure continuous progress toward emission reduction goals.
Carbon Intensity Indicator (CII) and vessel performance
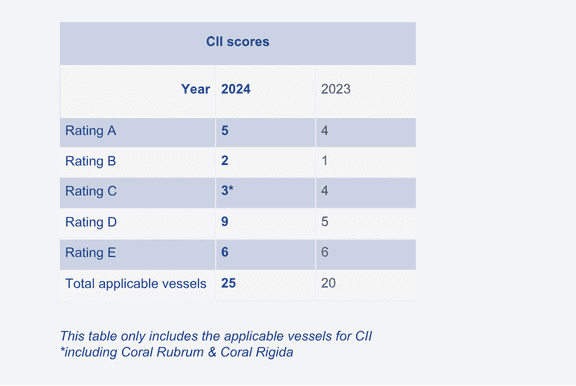
The Annual Efficiency Ratio (AER) is adjusted using specific reduction factors, including cargo reliquefication, ice navigation, and ice-class capabilities. Once modified, the AER is used to determine the corresponding Carbon Intensity Indicator (CII), which depends on the vessel type (gas carrier or LNG carrier) and summer deadweight.
Implementation & regulatory updates
2023 marked the first mandatory year for CII reporting. While the CII serves as an emissions reduction indicator, it has limitations, and the IMO is currently reviewing its effectiveness. An updated CII regulation is expected in 2025.
Vessel exemptions & challenges
Exemptions:
Three vessels under 5,000 GT are exempted from CII reporting. Additionally, the F-type series and Coral Encanto were reintroduced because they engaged in international voyages.
Non-Exempted LNG bunker vessels:
LNG bunkering vessels, such as Coral Methane and Coral Favia, continue to receive E ratings annually. There is an ongoing dialogue with the IMO to seek exemptions for these vessel types.
Vessel performance & idle time impact
Several vessels recorded E scores due to specific operational patterns:
- Coral Star: short-distance voyages between Lavera and Vada, with extended idle days under an INEOS charter.
- Coral Encanto: resumed international voyages in October 2024, engaging in short Caribbean voyages for customer NFE, similar to Coral Anthelia, which also received an E rating.
- Coral Fungia: experienced long idle periods and repairs between May and August, affecting its score.
Impact of ShaPoli (Shaft Power Limitation) & EEXI regulations
The implementation of ShaPoli, introduced as part of EEXI regulations, has positively influenced efficiency scores. However, the greatest impact on CII scores continues to be the operational profile of each vessel. Continued optimisation of voyage planning and discussions with IMO stakeholders will be essential in refining the approach to CII performance improvements.
